Documentation
Timings
Using the built-in timing functions to profile and optimize your PixelScript code.
Performance is incredibly important for large scale projects.
PixelScript does automatic measurements of execution time for specific interop calls, such as class loading and scheduler execution. However, sometimes you may want to measure the execution time of specific sections of your PixelScript code to identify bottlenecks and optimize performance.
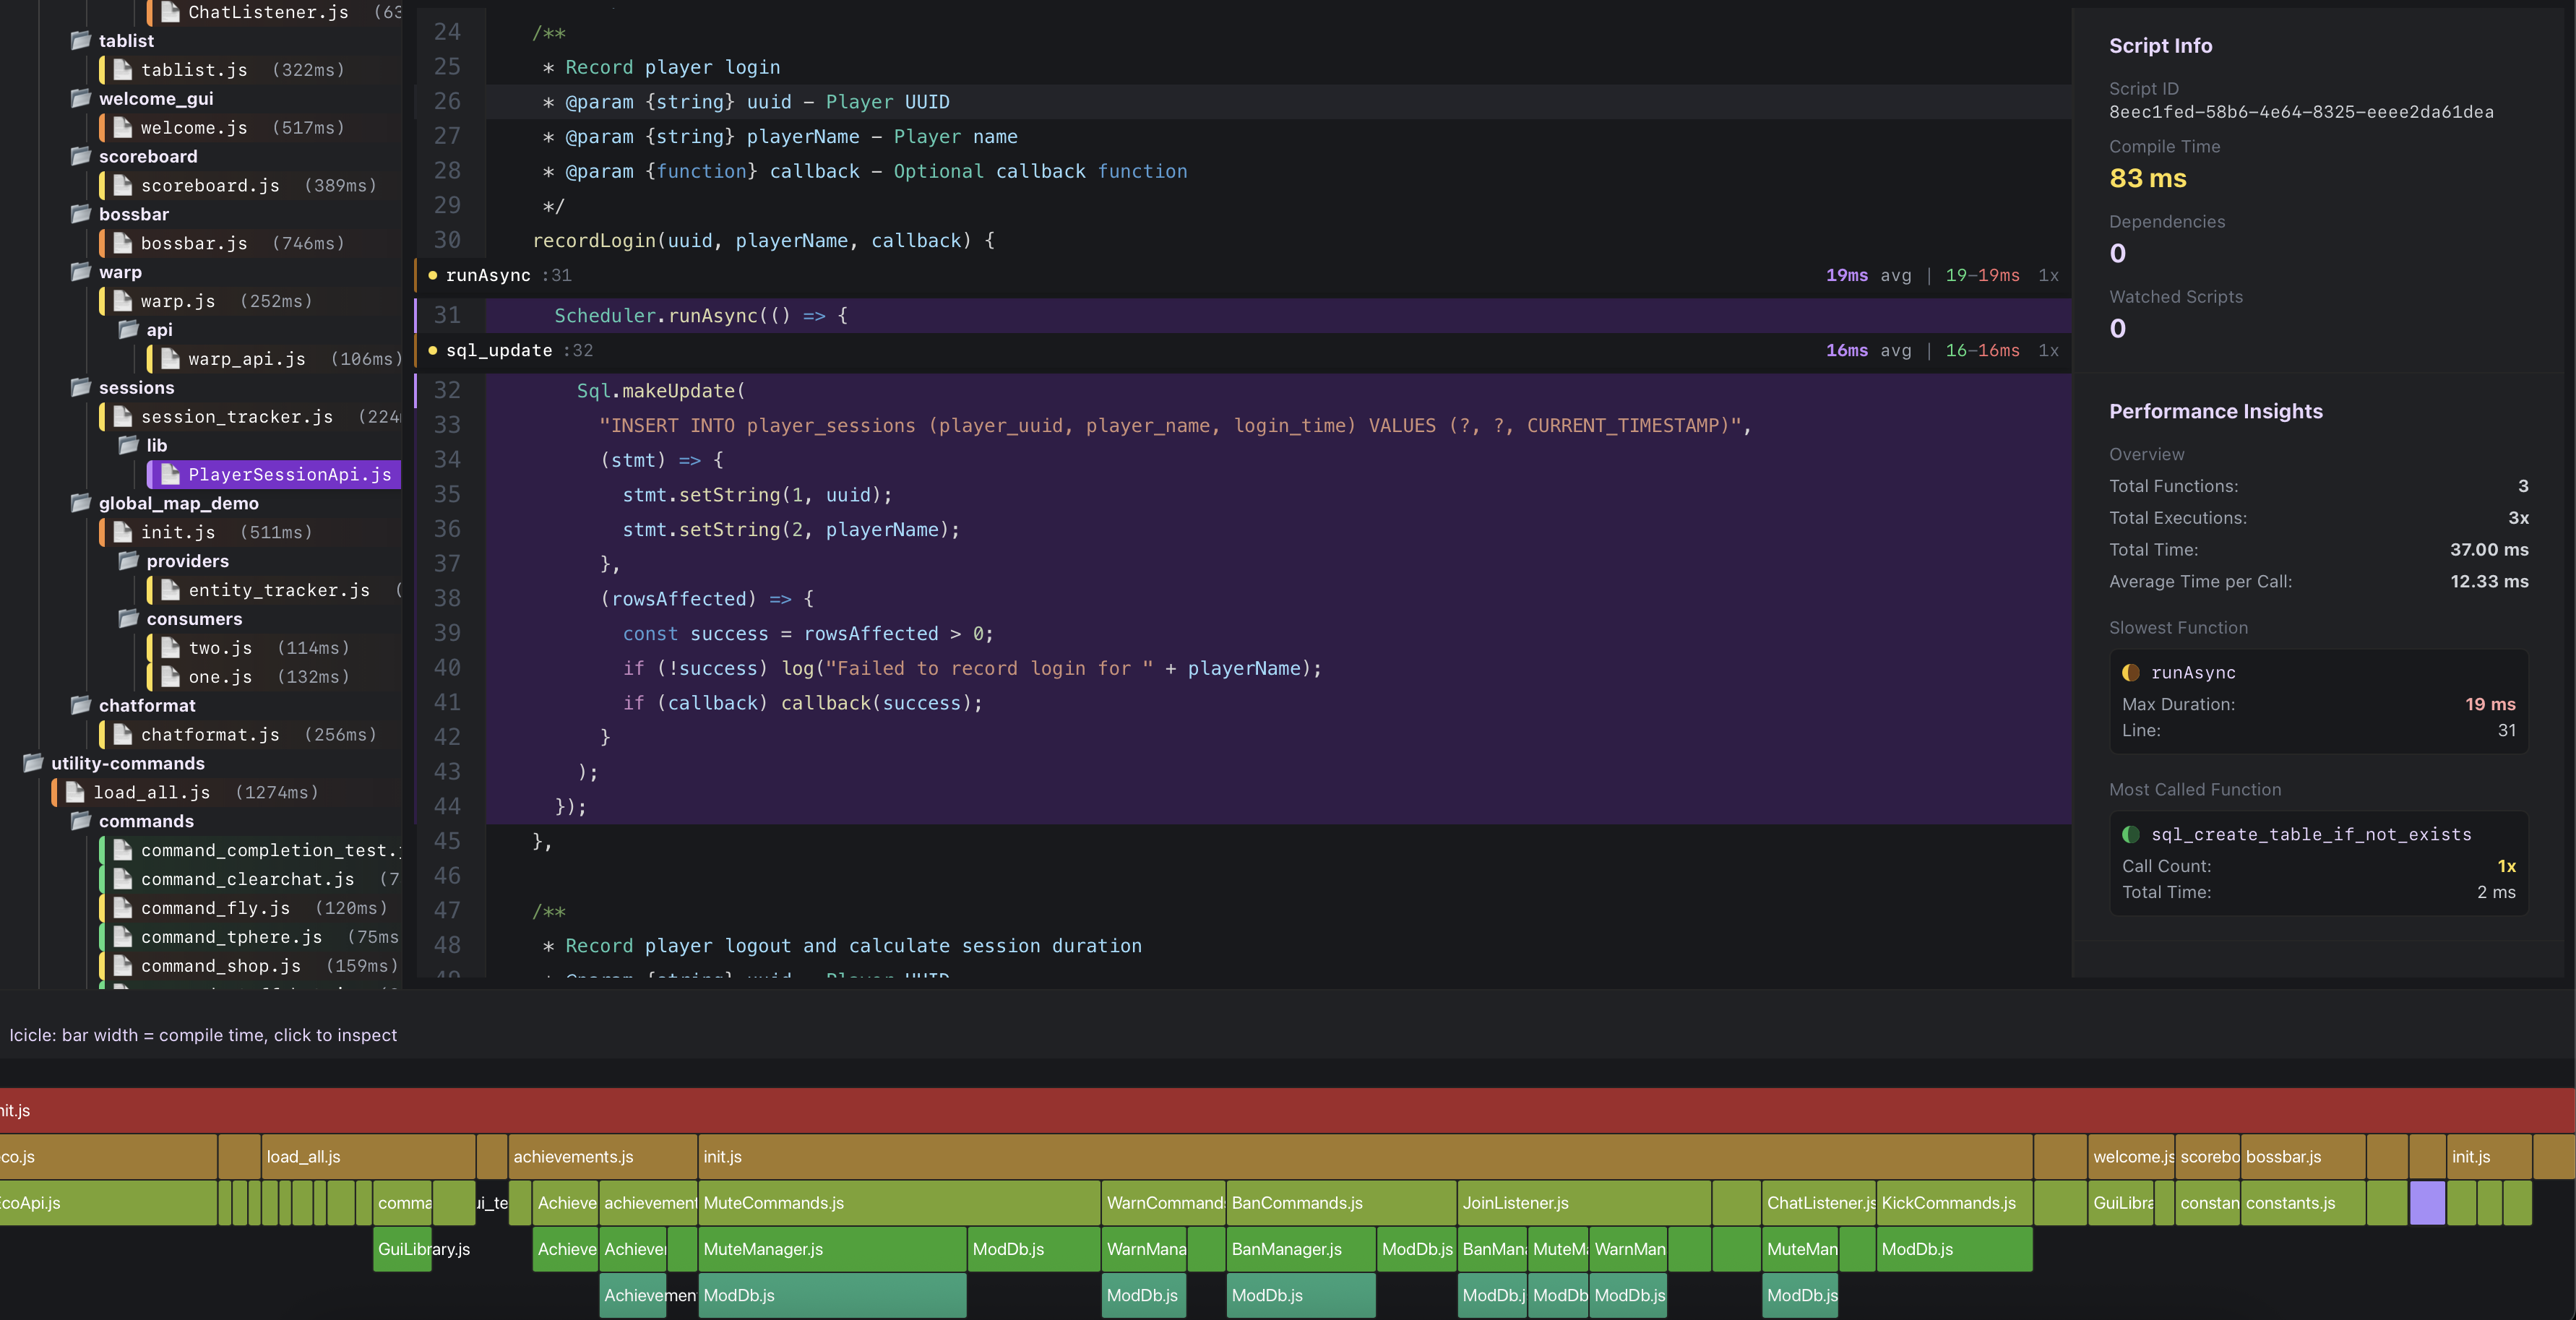
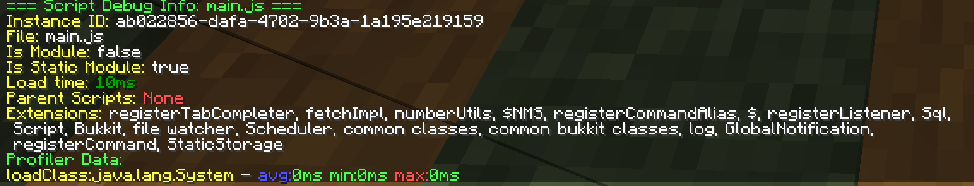
You can view these timings in-game, using /script info <file>, or in the web-based script manager (/script viewer)
Note
This feature is still in beta, and may change in future releases. Using the web viewer will share your project code with the server hosting the viewer, where it'll be stored for 15 minutes.
Working with java types for Java API's
Direct access to the Bukkit server instance for advanced server interactions.